A creative coding note on Grid Graffiti, a tiny Python project that turns text into a GitHub-style contribution grid while staying honest about generated history.

Generative concept art for the post: contribution-grid cells as a little luminous code canvas.
Grid Graffiti is a small Python art hack with a slightly mischievous shape: it turns text into a GitHub-style contribution grid.
The idea is simple enough to fit in one sentence. Render a message with a 5x7 bitmap font, map the lit pixels onto a 53-week calendar, and optionally create a brand-new local Git repository with backdated commits for each lit cell.
The fun part is that the project sits at a strange little intersection:
- bitmap fonts
- calendar math
- SVG generation
- CSV manifests
- Git author and committer dates
- CLI safety rails
- the ethics of generated activity
That combination is exactly why I wanted to build it. It is not just a joke about the contribution graph. It is a tiny lab for understanding how text, time, and metadata can become an image.
The Output
Section titled “The Output”The sample message is HELLO.

The project-native SVG output from Grid Graffiti. Every green square is a lit bitmap cell mapped to a date.
Running the script in preview mode prints the grid before it does anything that touches Git:
python3 grid_graffiti.py "HELLO" --today 2026-06-23 --align leftThat produces a terminal preview like this:
Text: HELLOReference date: 2026-06-23Grid starts: 2025-06-22 (Sunday)Current/rightmost week starts: 2026-06-21Lit cells: 73
#...#.#####.#.....#......###.........................#...#.#.....#.....#.....#...#........................#...#.#.....#.....#.....#...#........................#####.####..#.....#.....#...#........................#...#.#.....#.....#.....#...#........................#...#.#.....#.....#.....#...#........................#...#.#####.#####.#####..###.........................
Dry run only. Add --write-repo to create the local demo repository.
The dry run matters. This project can generate commit history, so the default behavior should be inspection, not mutation.
Turning Letters Into Pixels
Section titled “Turning Letters Into Pixels”The first layer is deliberately old-school: a hand-written 5x7 bitmap font.
Each glyph is just a tuple of strings, where # means “on” and . means “off”:
FONT: dict[str, tuple[str, ...]] = { "H": ("#...#", "#...#", "#...#", "#####", "#...#", "#...#", "#...#"), "E": ("#####", "#....", "#....", "####.", "#....", "#....", "#####"), "L": ("#....", "#....", "#....", "#....", "#....", "#....", "#####"), "O": (".###.", "#...#", "#...#", "#...#", "#...#", "#...#", ".###."),}The renderer normalizes text to uppercase, rejects unsupported characters, and joins glyphs with a blank column between letters:
def text_bitmap(text: str) -> list[list[bool]]:    """Render supported text into a seven-row bitmap."""    rows: list[list[bool]] = [[] for _ in range(ROWS)]
    for char_index, char in enumerate(text):        glyph = FONT[char]
        if char_index:            for row in rows:                row.append(False)
        for y, glyph_row in enumerate(glyph):            rows[y].extend(pixel == "#" for pixel in glyph_row)
    return rows
There is something satisfying about keeping this part plain. No font parser, no dependency, no rasterization library. Just a tiny alphabet made of strings.
Mapping Pixels Onto Time
Section titled “Mapping Pixels Onto Time”The GitHub-style contribution grid is 53 columns by 7 rows:
- each column is a week
- each row is a weekday
- the rightmost column is the week containing the reference date
- the leftmost column starts 52 weeks before that
The project computes the Sunday for the current week, then walks backward:
def current_week_sunday(reference: date) -> date:    # Python: Monday=0 ... Sunday=6    days_since_sunday = (reference.weekday() + 1) % 7    return reference - timedelta(days=days_since_sunday)

def grid_start(reference: date) -> date:    return current_week_sunday(reference) - timedelta(weeks=COLUMNS - 1)
Once the start date is known, every lit pixel has a deterministic date:
def lit_pixels(    bitmap: list[list[bool]], reference: date, alignment: str) -> list[Pixel]:    """Map lit bitmap cells to contribution-grid dates."""    start = grid_start(reference)    width = len(bitmap[0])    offset = placement_offset(width, alignment)
    pixels: list[Pixel] = []    for row in range(ROWS):        for x in range(width):            if bitmap[row][x]:                column = offset + x                pixel_day = start + timedelta(days=column * 7 + row)                pixels.append(Pixel(column=column, row=row, day=pixel_day))    return pixels
For the sample HELLO render, that gives 73 lit cells. The generated CSV records the dates before any commits are created:
column,row,weekday,date,commits_for_cell0,0,Sun,2025-06-22,10,1,Mon,2025-06-23,10,2,Tue,2025-06-24,10,3,Wed,2025-06-25,10,4,Thu,2025-06-26,1That manifest is useful because it makes the artwork auditable. You can inspect the planned dates as data, not just as a visual trick.
Writing the SVG Preview
Section titled “Writing the SVG Preview”The SVG export is just as direct as the bitmap stage. Grid Graffiti draws every calendar cell and chooses the fill based on whether the (column, row) pair is lit:
def write_svg(    path: Path,    text: str,    reference: date,    pixels: Iterable[Pixel],) -> None:    lit = {(pixel.column, pixel.row) for pixel in pixels}    width = PADDING * 2 + COLUMNS * CELL + (COLUMNS - 1) * GAP    height = PADDING * 2 + ROWS * CELL + (ROWS - 1) * GAP + 34
    rects: list[str] = []    for column in range(COLUMNS):        for row in range(ROWS):            x = PADDING + column * (CELL + GAP)            y = PADDING + 28 + row * (CELL + GAP)            fill = "#39d353" if (column, row) in lit else "#161b22"            rects.append(                f'<rect x="{x}" y="{y}" width="{CELL}" height="{CELL}" '                f'rx="2" fill="{fill}"/>'            )
I like this part because it keeps the project useful even if you never write a single Git commit. It can just be a little grid-poster generator.
The Git Part
Section titled “The Git Part”When --write-repo is enabled, the script creates a new local repository, writes a pixels.txt payload, and makes one or more commits for every lit cell.
The important trick is that Git reads author and committer timestamps from environment variables:
env = os.environ.copy()stamp = git_timestamp(pixel.day, commit_hour)env["GIT_AUTHOR_DATE"] = stampenv["GIT_COMMITTER_DATE"] = stamp
run_git(    output_dir,    "commit",    "-m",    f"demo pixel col={pixel.column} row={pixel.row} layer={layer}",    env=env,)
The timestamp helper uses UTC so the demo stays deterministic across machines:
def git_timestamp(day: date, hour: int) -> str: # Fixed UTC timestamp keeps the demo deterministic across machines. moment = datetime.combine(day, time(hour=hour), tzinfo=timezone.utc) return moment.isoformat()A full local demo command looks like this:
python3 grid_graffiti.py "HELLO" \ --today 2026-06-23 \ --align center \ --commits-per-pixel 3 \ --author-name "Your Name" \ --write-repo \ --output-dir hello-gridThe result is a local-only repository with synthetic dated commits. You can inspect it, screenshot it, or throw it away.
Guardrails
Section titled “Guardrails”The safety rules are the difference between a fun experiment and a footgun.
Grid Graffiti:
- defaults to dry run mode
- refuses unsupported text
- refuses text wider than the 53-week grid
- refuses to write into a non-empty output directory
- initializes its own local repository
- checks that no Git remote is configured
- does not push, authenticate, add remotes, or contact GitHub
- lets the user set the generated author identity explicitly
The output directory check is intentionally boring:
def ensure_safe_output_dir(output_dir: Path, write_repo: bool) -> None: """Refuse to write into files or non-empty directories.""" if output_dir.exists(): if not output_dir.is_dir(): raise RuntimeError(f"{output_dir} exists and is not a directory.") if any(output_dir.iterdir()): raise RuntimeError( f"{output_dir} is not empty. Refusing to modify an existing folder." ) elif write_repo: output_dir.mkdir(parents=True)And after repository creation, the script checks remotes again:
def assert_no_remotes(repo: Path) -> None: remotes = run_git(repo, "remote") if remotes.strip(): raise RuntimeError( "This educational script refuses to operate when a Git remote exists." )Could someone still misuse generated history after the script finishes? Yes. Software guardrails are not a replacement for judgement. But the tool should make the honest path the obvious path.
Testing The Weird Bits
Section titled “Testing The Weird Bits”The project has a zero-dependency unittest suite covering the pieces most likely to drift:
python3 -m unittest discoverSome of the tests are about ordinary rendering behavior:
def test_text_bitmap_for_hello_has_expected_shape(self) -> None:    bitmap = grid.text_bitmap("HELLO")
    self.assertEqual(len(bitmap), grid.ROWS)    self.assertEqual(len(bitmap[0]), 29)    self.assertTrue(all(len(row) == 29 for row in bitmap))    self.assertEqual(sum(sum(row) for row in bitmap), 73)
Some are about calendar correctness:
def test_grid_start_is_52_weeks_before_current_week(self) -> None: self.assertEqual(grid.grid_start(date(2026, 6, 20)), date(2025, 6, 15))And one test actually creates a temporary local Git repository, writes dated commits, and checks the resulting log:
dates = subprocess.run(    ["git", "log", "--reverse", "--pretty=%ad", "--date=short"],    cwd=repo,    check=True,    text=True,    stdout=subprocess.PIPE,).stdout.splitlines()
self.assertEqual(    dates,    ["2026-01-04", "2026-01-04", "2026-01-05", "2026-01-05"],)
For a tiny creative coding project, this test suite may look a little serious. That is the point. The project is playful, but the thing it manipulates is real history metadata.
Why Build This?
Section titled “Why Build This?”Because creative coding is a great way to learn.
Grid Graffiti is not really about “gaming the graph.” It is about taking a familiar interface, the contribution calendar, and treating it as a programmable canvas. Along the way, the project touches a bunch of useful ideas:
- representing letters as bitmap data
- converting a visual coordinate system into dates
- designing CLIs that preview before they write
- generating SVGs without dependencies
- using CSV as a transparent manifest
- understanding how Git stores author and committer dates
- making ethical constraints visible in the tool itself
It is tiny, but it is a good reminder that even simple projects can have layers.
You can find the repo here: zackabrah/grid-graffiti.
Final Result
Section titled “Final Result”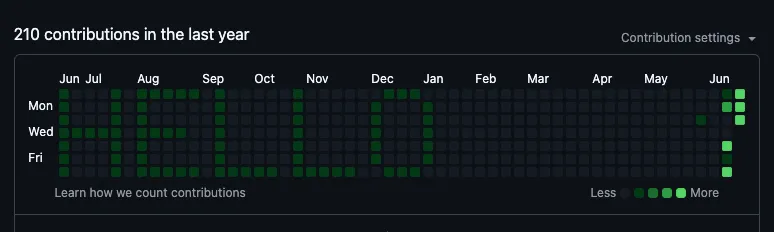
disclaimer: this TOTALLY wasn’t performed on my personal account… 🤪
Ethical Disclaimer
Section titled “Ethical Disclaimer”Grid Graffiti is an educational and artistic project. It creates synthetic commit history in a new local repository.
Do not use it to misrepresent real work, inflate professional activity, deceive recruiters or collaborators, impersonate someone else, pollute an existing project history, or bypass platform rules and community expectations.
If you publish generated history, make it clear that the repository is a demo or artwork. The script includes safety guardrails, but you are responsible for how you present the output.